Web • Ecom • Ozon
Web • Ecom • Ozon
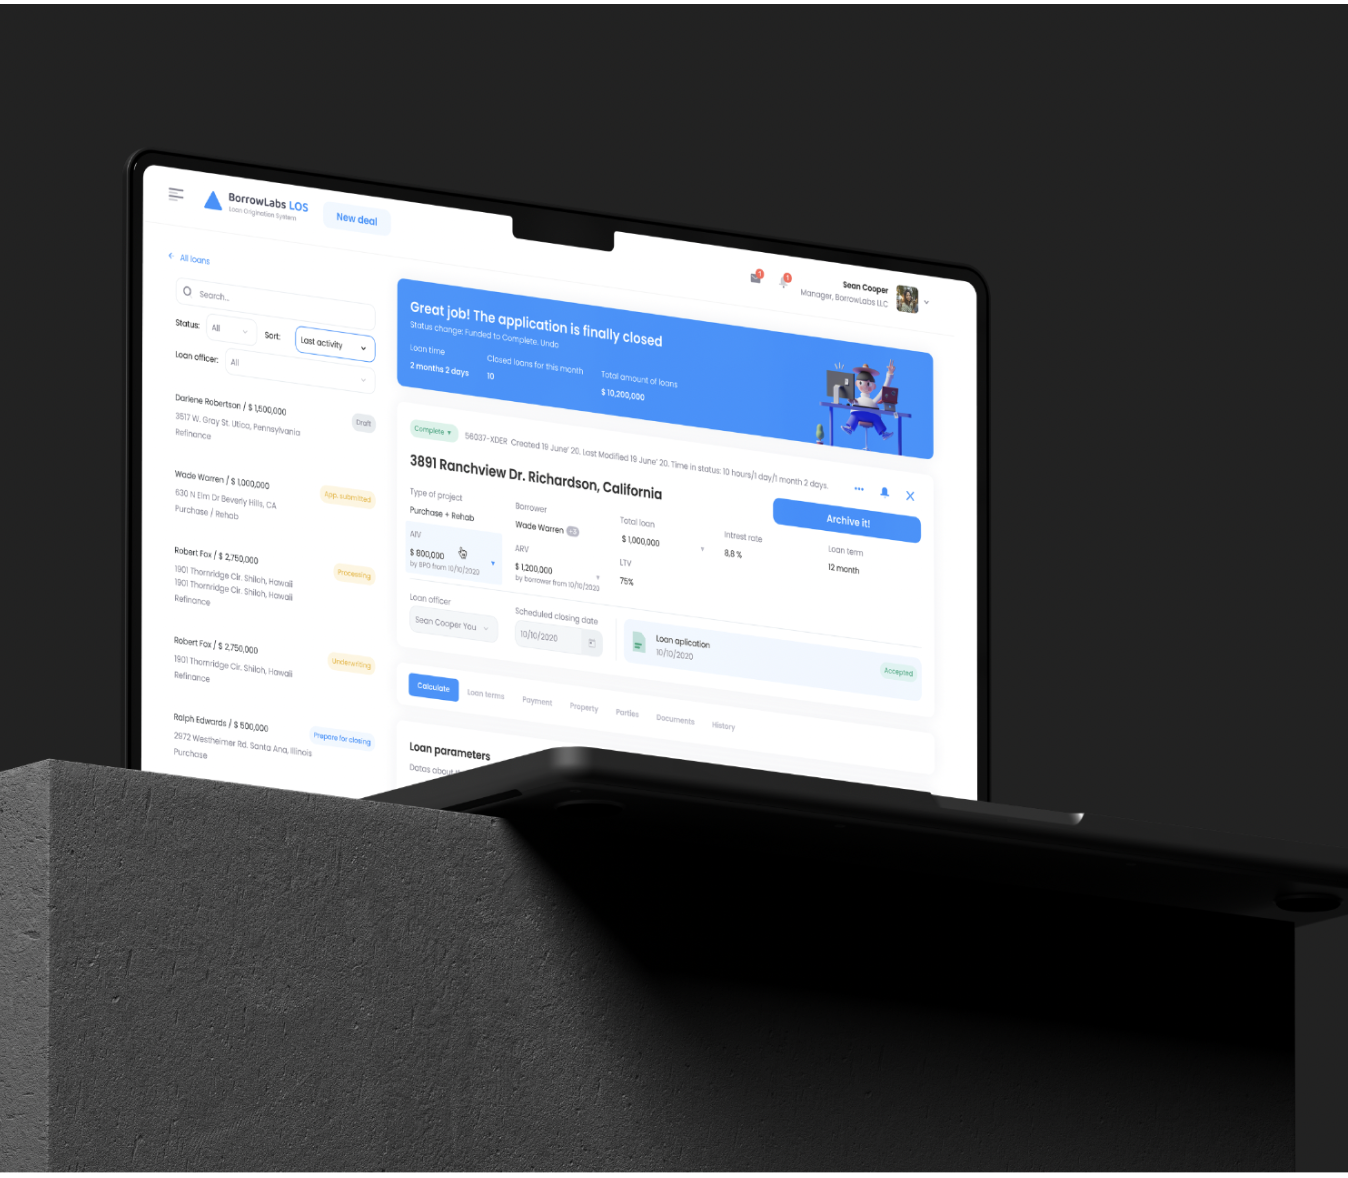
In this design, I will delve into the process of redesigning a section of the promotions. Promotions play a crucial role in driving sales, as buyers are more likely to purchase items that are discounted or part of a promotional campaign.
Our goal was to design a new promotions list that would increase Gross Merchandise Value (GMV) and provide value for Ozon. Through research and iterative testing, several critical problems were identified, including overwhelming visual presentation, unclear benefits of promotions, lack of discount information, and confusion regarding limitations and deadlines.


2. Unclear benefits of promotions: Sellers lacked information on how promotions would be displayed and promoted, and how these efforts would translate into increased value for them.
3. Lack of discount information: Sellers lacked visibility into the discount rates associated with promotions, making it challenging for them to make informed decisions about participation.
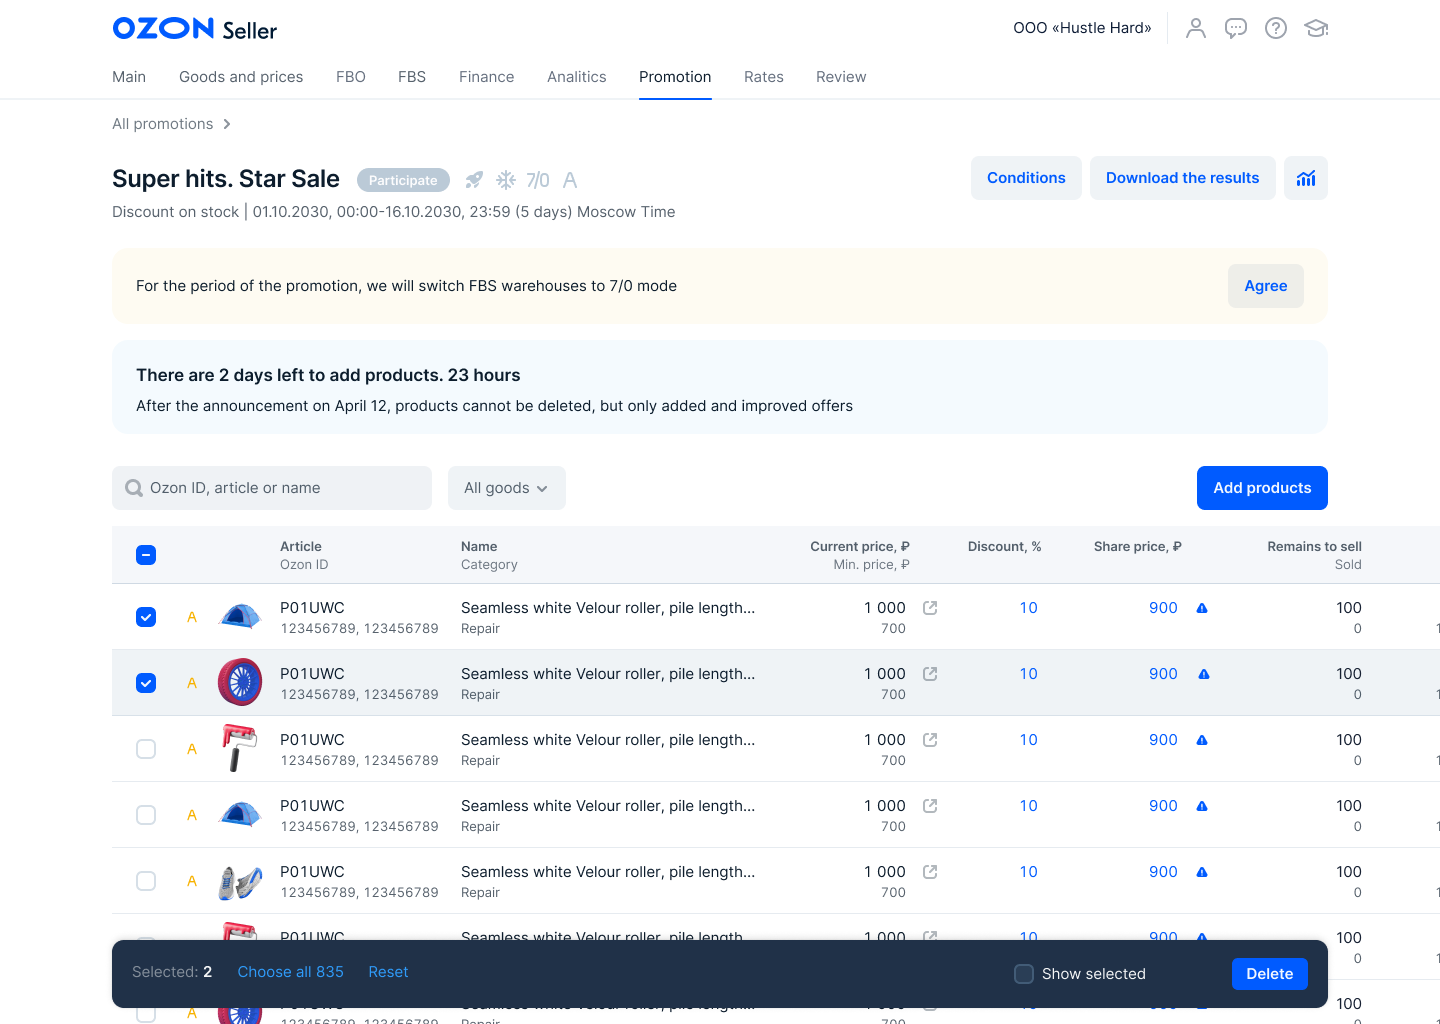
4. Unclear limitations and deadlines: Sellers were unaware of specific limitations, such as deadlines for adding new goods, leading to increased support requests during peak demand periods.
1. Overwhelming visual presentation: The full page of promotions was overly colorful, making it difficult for sellers to locate and join the relevant promotions amidst the clutter.
During our research phase, we identified several critical problems:
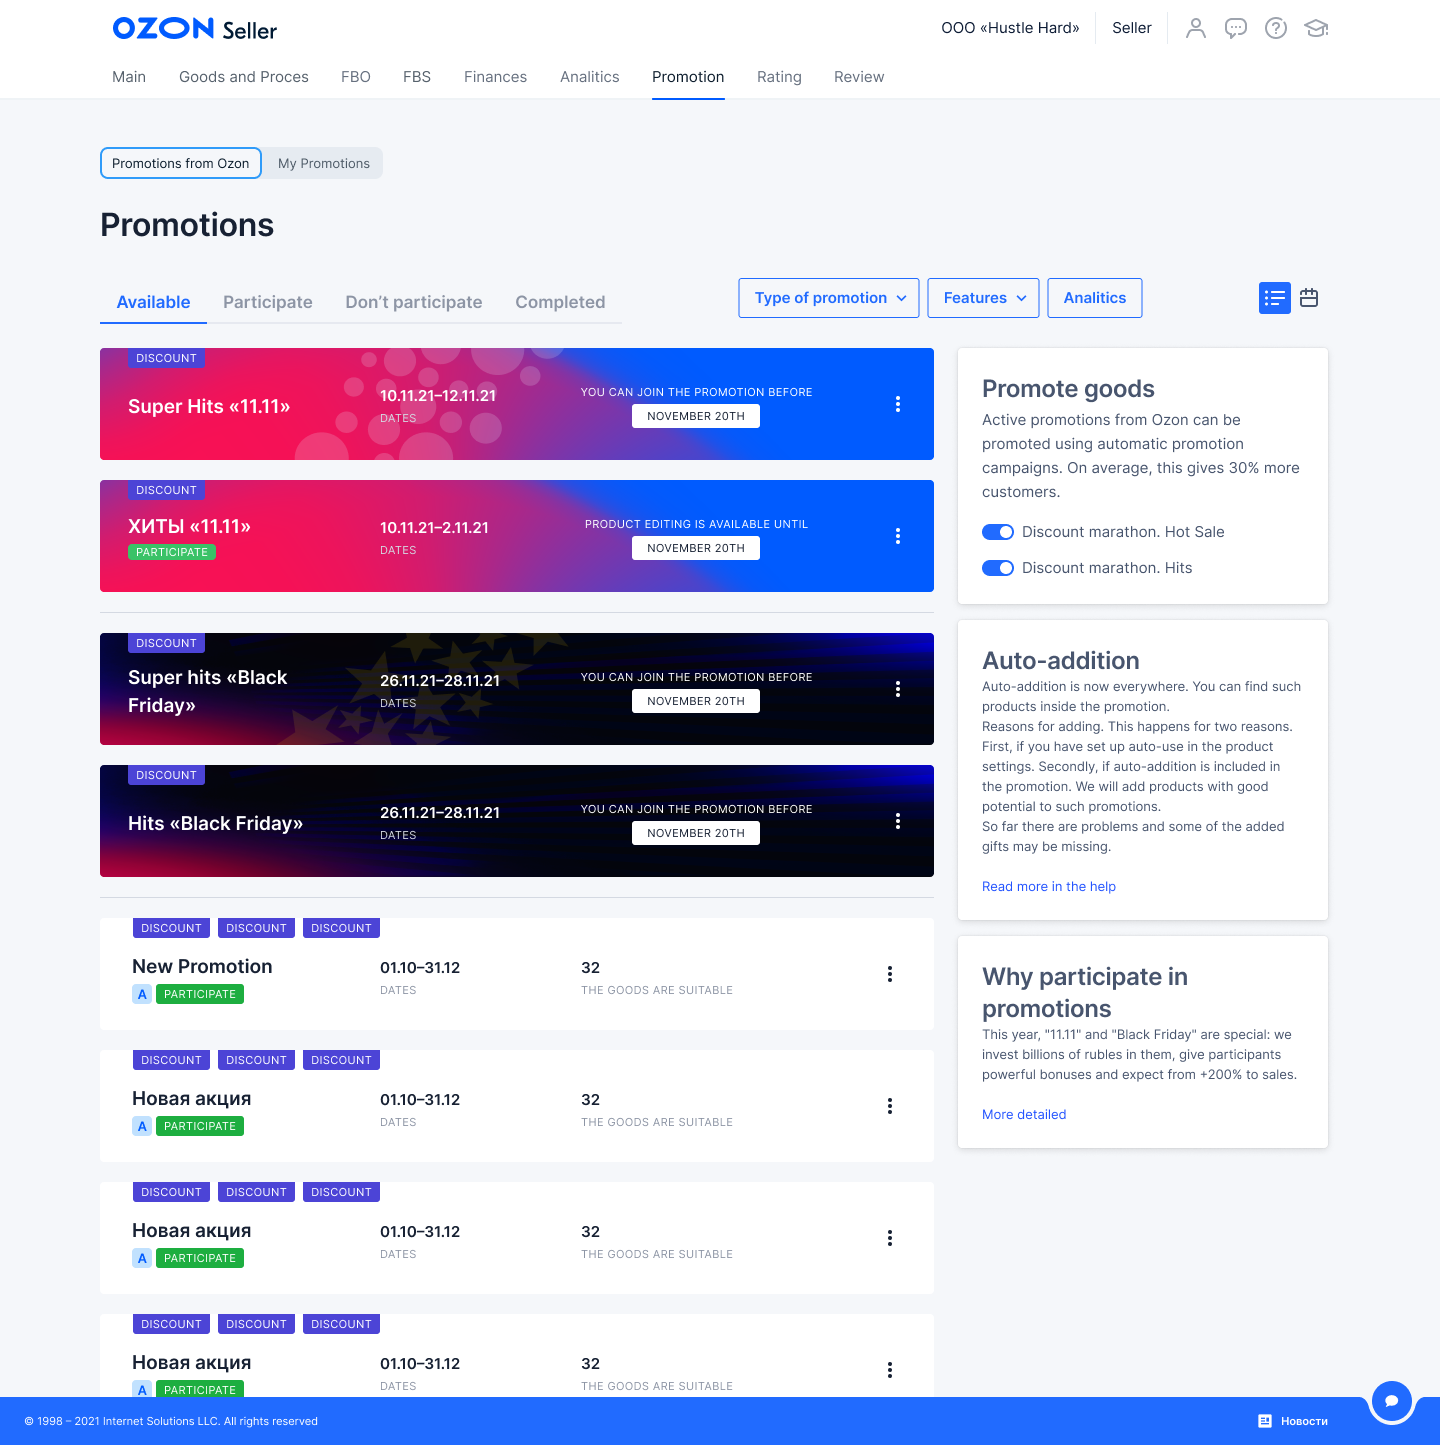
The page that needed to be improved
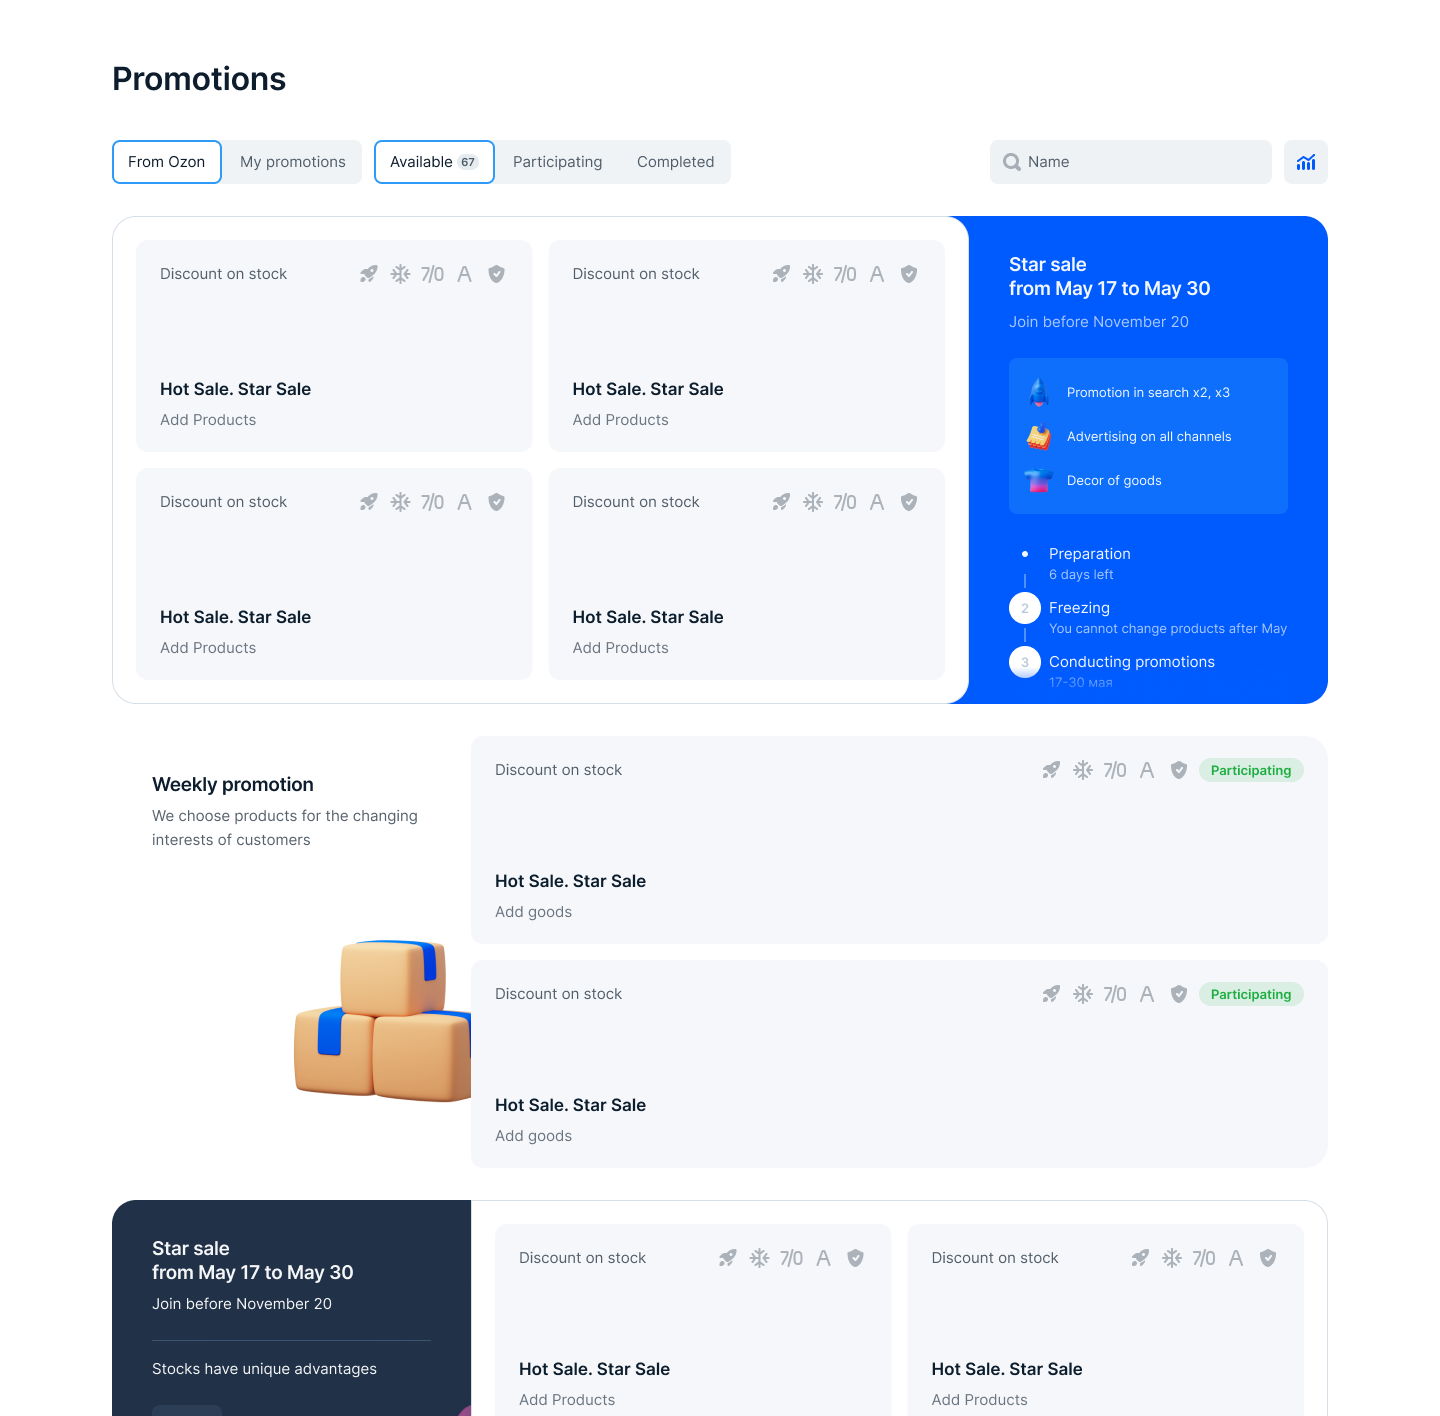
Initial drafts. The shares are grouped by name. The page has become less bright. Advantages are shown through icons. Showed a timeline with deadlines to highlight deadlines and restrictions
To address these problems, the Product Owner and I generated ideas and created initial drafts. We gathered feedback from various team members and conducted multiple rounds of research, dividing participants into three groups of three individuals each. After each round, we iteratively refined our designs to enhance convenience and usability.
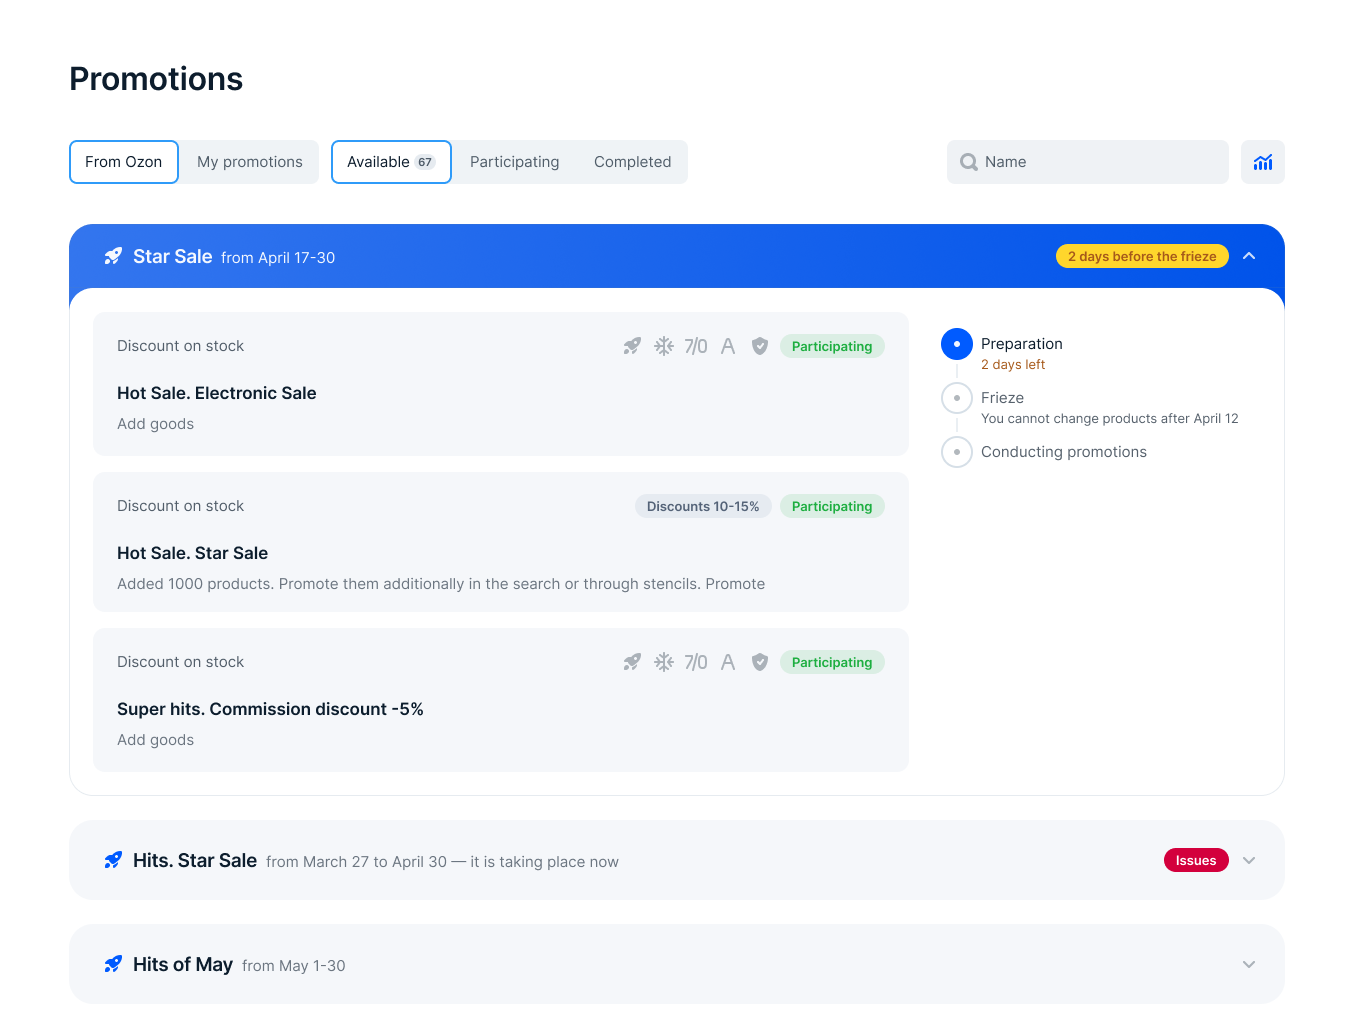
Design for the first group of testing
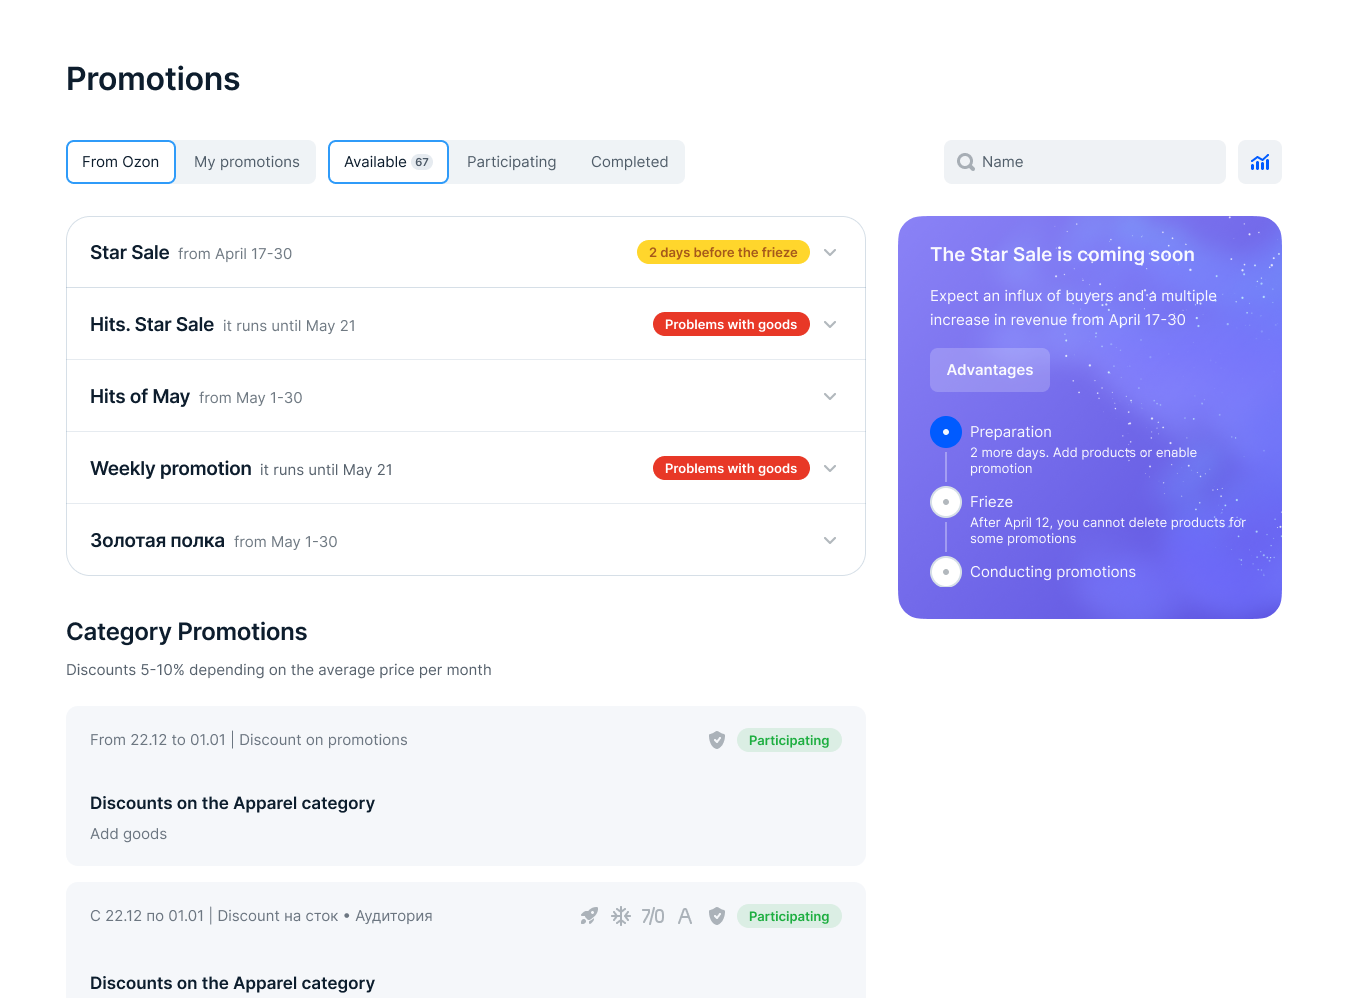
Design for the third group of testing
The results of the testing were documented in a table, with each hypothesis recorded in the first column and subsequent cells indicating confirmation (violet) or non-confirmation (blue) of the hypothesis.
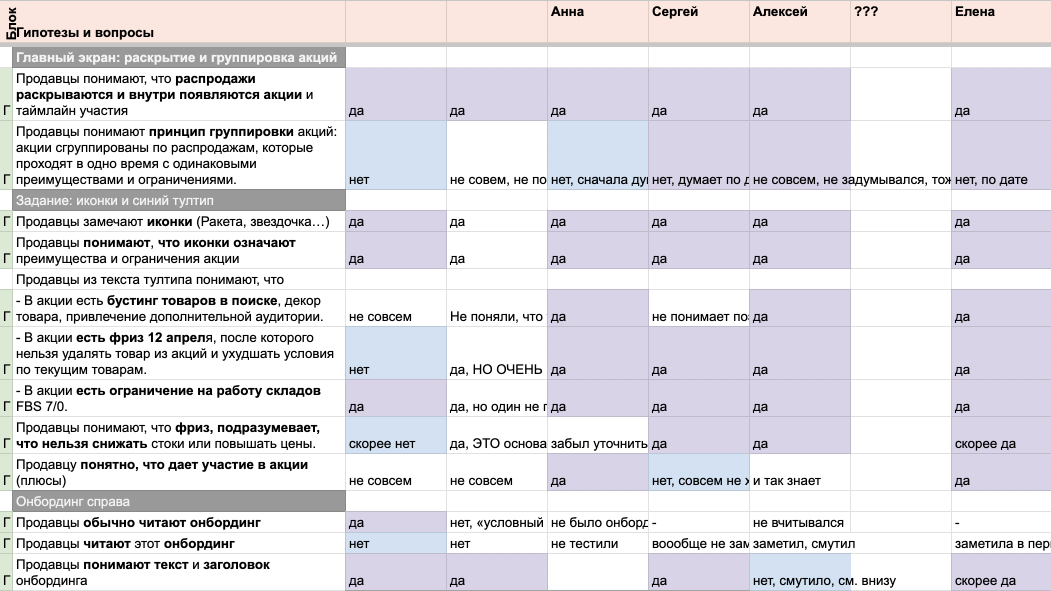
In total, there were 38 hypotheses and 9 respondents
Based on the insights gained from the testing, we made the following key observations:
• Users value comprehensive information and are willing to read details about the benefits and limitations of promotions.
• Users found the promotion grouping confusing. Initially, we had an abundance of promotions, but it became clear that the page structure needed to be modified.
• Information about new promotions failed to capture users' attention. Respondents tended to close the modal form immediately upon seeing it.
Using these research findings, we restructured the page design accordingly. However, some team members expressed doubts about the design, leading to a new requirement: providing users with a planning tool for promotions during high seasons when multiple promotions follow one another without a break. We were tracking the number of added products. This was one of our main metrics. The idea emerged to allow users to add products to promotions in advance. This realization led to the development of a calendar widget.
.gif)
Implementing the calendar widget was challenging, but we believed it would greatly assist users in planning their budgets for several months. Consequently, we conducted a second round of research to refine and adjust the design based on user feedback.
All promotions are grouped by color and by benefits. For example, Electronics sales are highlighted in green in the calendar, in the list and in the promo banner. This is done so that the seller understands exactly how his goods will be advertised.
In order for the seller to understand what advantages there are from joining the general list, all stocks are grouped into three groups: Global stock (advertising on all channels, promotion in search, they last two weeks), long stocks (we promote in search, they last about a month), categorical stocks (not promoted in search and not advertised).
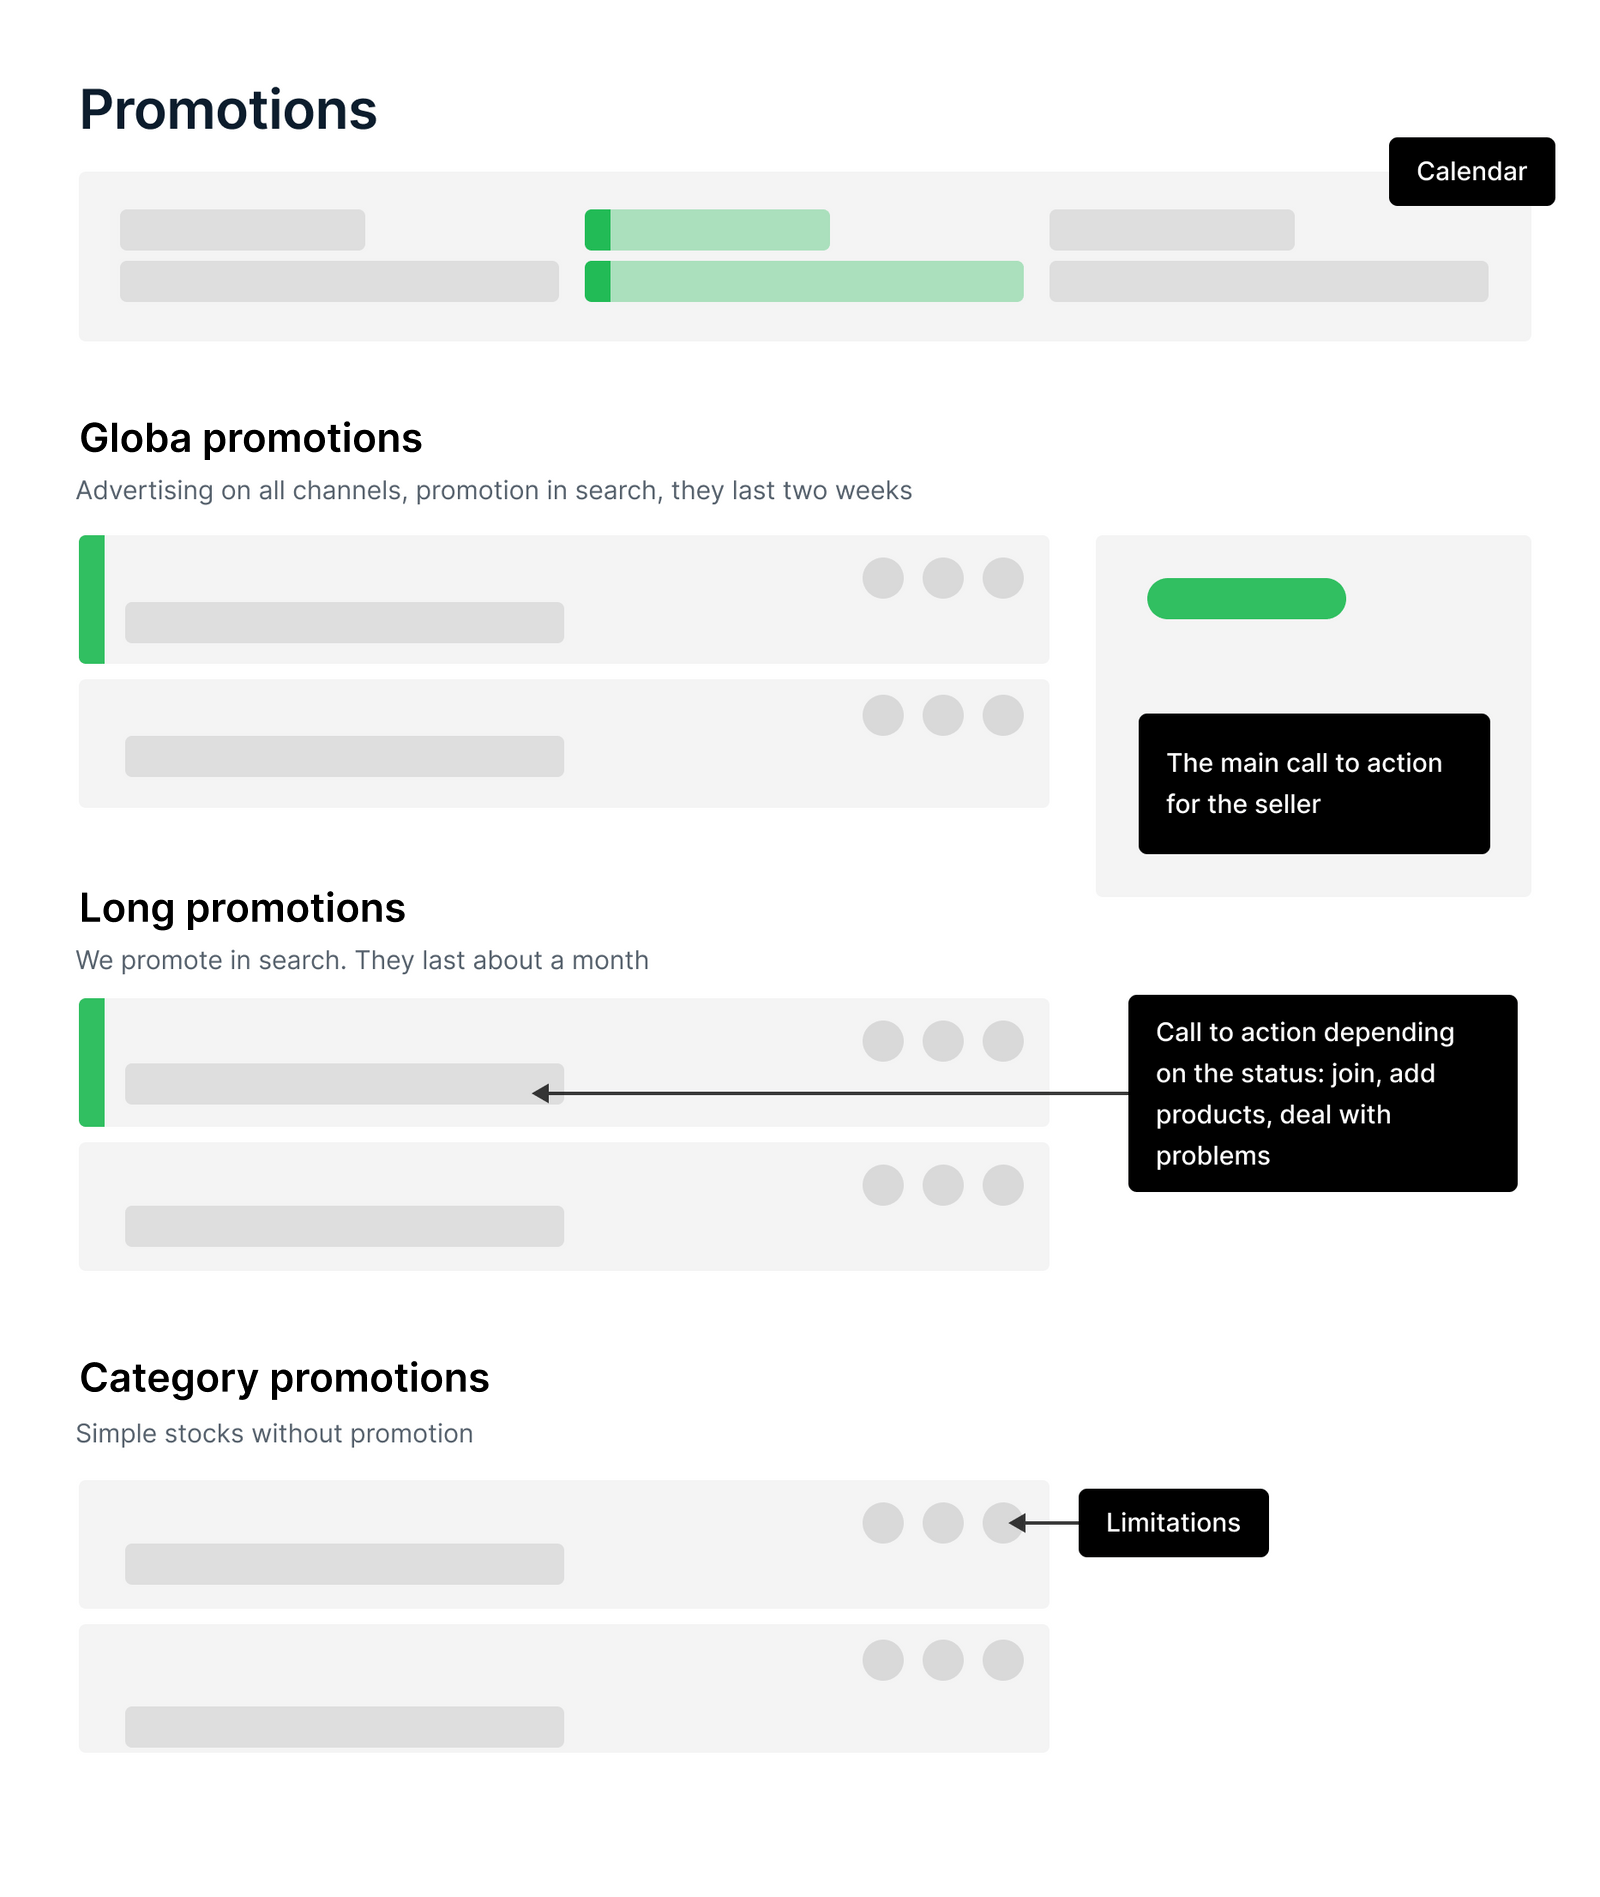
Page structure

The final design. Stocks are grouped by name and by benefits. This is a double grouping. This is exactly what was missing in the initial sketches
The component of the promotion card has more than 20 states, depending on the type of promotion, status, and added products.

Screenshot of a piece of the compоnent specification
Our marketers wanted to additionally highlight unique promotions. For these purposes, I added two types of animation for the black block. By the way, this block also has about 10 states.
Animations, which marketers, if necessary, choose together with the color of the promotion in their internal system
We are still collecting accurate data on how much the user experience has improved, but it is already possible to draw conclusions.
1. The NPS has increased from 7 points to 8 when it decreases throughout the product. We conducted such a survey after the launch.
2. The full page of promotions was overly colorful. Now the stock cards are not so bright.
3. Double grouping helps to understand the advantages of stocks.
4. We added calendar and restriction icons to stock cards. Testing has shown that this is enough to find out deadlines and limitations.
Overall, I made several visual changes to the promotion page to address the issues identified during testing. These changes included simplifying the color scheme, providing clearer information about the benefits and limitations of promotions, and introducing a black block on the right side of the page to help sellers better understand which actions to prepare for and where to join.